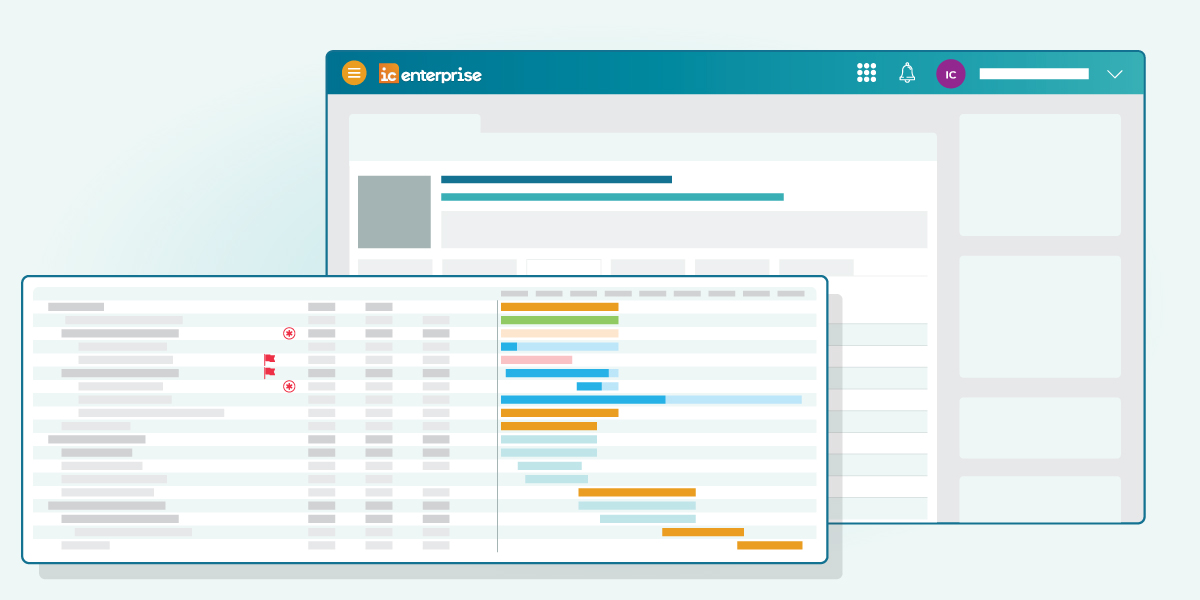
This summer was pretty hot, yet we manage to develop some cool features. In Innovation Cloud’s Summer release, we’ve introduced a Gantt chart that will remove all the anxiety that innovation leaders have in front of their top management. No more overdue dates, no more resources waste. The management of single innovation is now easier as it is graphically represented in form of manageable tasks, visualizing the dependencies between them, allocated resources and the overall processing time, which allows proper progress tracking.
In this blog, we will explain why Gantt charts are so useful, how to use them to organize and monitor your innovations and keep your team informed on the progress.
The origins of a Gantt Chart
Back in 1896, Polish engineer Karol Adamiecki came up with an idea of graphically displaying interdependent processes to enhance the visibility of production processes that he called a “harmonogram”.
Around the years 1910 - 1915, American mechanical engineer and management consultant Henry Gantt, had very much the same idea – creating bar charts that will help supervisors in the steel industry to quickly visualize if the production is on track, ahead or behind the schedule. From that point on, Gantt’s name is associated to this important and common project management tool still used today, which was quite an innovative concept back then. Since Karol Adamiecki published his work in 1931, today it is generally recognized that he had the idea first.
What is a Gantt Chart?
Today, a Gantt Chart is the most commonly used tool for tracking project schedules and monitoring the progress of a project.
Simply put, a Gantt Chart is a bar chart that shows the progress of a project/innovation in timeline format. Graphically, the Gantt chart consists of horizontal scheduling bar with a timeline, from left to right, showing days, weeks or months, allowing for both planning and tracking of the innovation schedule. It is like a perfect mix of a spreadsheet, calendar, progress bar and resource management that will assist you to get the overall picture of your innovation’s progress.
With a Gantt chart, you will be able to see who is responsible for each task, how long each task will take, what are the dependencies between tasks or which tasks need to be completed before others can start.

Gantt chart will assist you to get a complete picture of:
- The start and end date of your innovation development
- All the phases within the development process
- All the tasks within the development process
- Task owners
- When each task starts and ends
- How task groups overlap and link with each other
- The completeness of each task
- The list of mandatory tasks
- The tasks with potential issues
The most important point is that, as your innovation moves forward, the Gantt chart will be updated to reflect all the changes as they occur. You will be able to immediately see if the development of your innovation is behind the schedule, so that you can take appropriate actions accordingly. And lastly, it will help you to keep your team and your managers up to date with the progress of your innovation.
Who will benefit from using a Gantt chart?
Many people have never heard of Gantt Chart while many cannot image their working day without it. Today, Gantt charts are commonly used for project planning, project management and innovation management. It is a very useful and informative tool, since it shows all the necessary information to keep you updated with the progress of your innovation.
Gantt chart is an efficient tool for following positions:
- Innovation Managers
- Innovation Leaders
- Project Managers
- Operations Managers
- CEOs
- Team(s) involved in development of innovation/project
- … and other control freaks.
Key Points
The role of Gantt chart within innovation management is that it provides a visual representation of what needs to be done and when, as well as what resources are needed throughout a given innovation. Within Innovation Cloud’s Innovations Application, Gantt chart enables you to visualize and understand information about the various tasks and phases of your NPD process, such as how far each task has progressed, how the tasks relate to each other, does a certain task carry additional risks and what resources are being used for each task. This information will enable you to have full control of the development activities of your innovation and empower you to launch your new product/services on time and on budget.