

There’s a particular kind of comfort that comes from a full pipeline.
Hundreds of ideas submitted. Three hackathons this quarter. An innovation committee that meets monthly. Engagement scores are trending up. A slide deck full of colorful funnels going from "Ideation" to "Scale."
It feels like momentum. It looks like progress. And in most organizations, it’s how the innovation function justifies its existence to the board.
The problem? None of it tells you whether innovation is actually working.
In our previous post, Beyond the Black Box, we argued that innovation in 2026 must stop being a creative sideshow and become a true operating discipline: structured, governed, and accountable to real business outcomes. If you’ve accepted that premise, a hard follow-up question becomes unavoidable: How do you know if the discipline is actually delivering?
Most companies don’t have a good answer. Not because they aren’t measuring, but because they’re measuring the wrong things.
The False Comfort of a Full Pipeline
Activity metrics are seductive because they’re easy to generate and even easier to celebrate. Submit an idea? That’s a data point. Run a workshop? That’s engagement. Move a project through Phase 1? That’s pipeline velocity.
The problem is that activity and outcomes are not correlated in the way most innovation leaders assume. You can run fifty pilots and scale zero. You can have ten thousand ideas submitted and generate no revenue. You can hit every phase-gate on time and still watch the portfolio flatline.
A pipeline that is full is not the same as a pipeline that is working.
This is the vanity metrics trap: the organizational tendency to optimize for what is easy to count rather than what actually matters. And it is far more dangerous than it looks, because it creates the illusion of a functioning innovation system while the real problems (poor idea quality, governance bottlenecks, misaligned priorities) go unaddressed.
The 5 Metrics That Feel Like Progress (But Aren’t)
1. Number of ideas submitted: Quantity is not quality. A campaign that generates 800 low-signal ideas is worse than a focused challenge that generates 40 high-potential ones. Raw submission counts measure participation, not strategic value, and they incentivize the wrong behavior from employees.
2. Phase-gate completion rate: Moving projects through the funnel on schedule feels like velocity. But if your gates aren’t making genuine kill/continue decisions. If projects are advancing because of inertia or political pressure rather than merit, then gate completion is just bureaucracy with a progress bar.
3. Number of pilots launched: As we explored in Pilot Purgatory, launching pilots is not the same as learning from them or scaling them. A high pilot count with a low scale rate is a sign of a broken system, not a productive one.
4. Employee engagement in innovation programs: Participation rates in hackathons, idea campaigns, and innovation workshops measure enthusiasm. That’s worth something, but it’s an input metric, not an outcome metric. An engaged workforce that produces nothing scalable is still a workforce producing nothing scalable.
5. Time-in-phase averages: How long a project spends in each phase is a useful operational metric, but only if you know what the right amount of time actually is. Measuring average dwell time without a benchmark tells you nothing about whether projects are moving at the right pace, too fast, or too slow.
None of these metrics should be abandoned entirely. But none of them should be the headline number in your innovation review, either.
What an Operating-Discipline Scorecard Actually Looks Like
If innovation is a business function (and it must be, in 2026), it deserves a scorecard built around the same principles we apply to sales, product, or operations: output quality, resource efficiency, and strategic alignment.
Here are the four metrics that belong at the center of that scorecard:
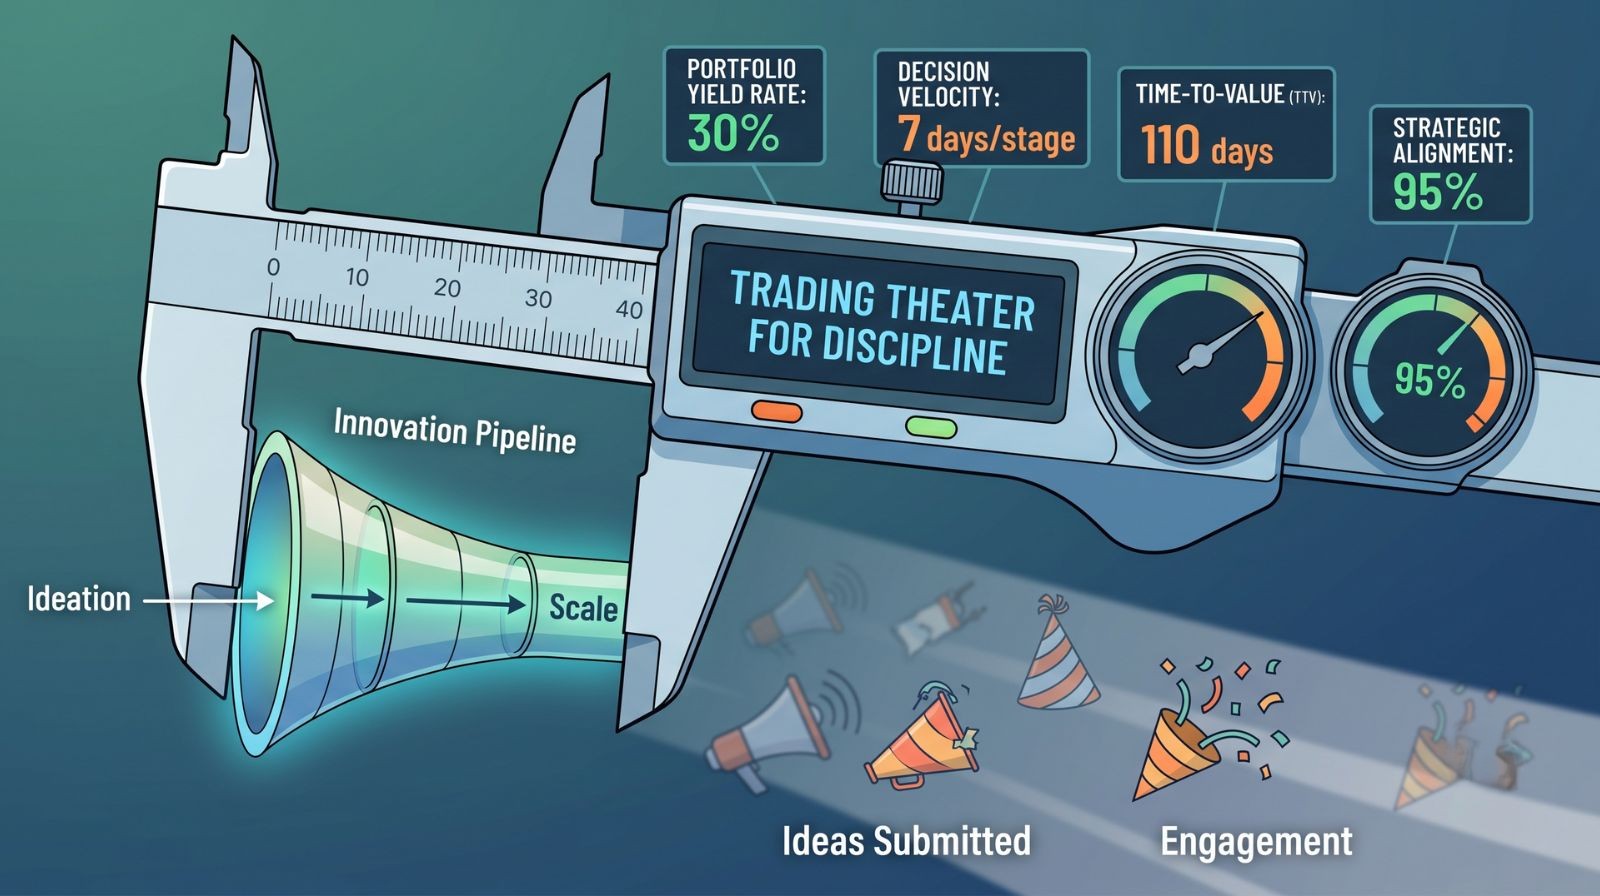
1. Portfolio Yield Rate: Of the projects that enter your pipeline in a given period, what percentage reach scale with measurable business impact? This is the single most honest measure of whether your innovation system is producing value. A yield rate of less than 5% in a mature program is a signal that something structural is broken, regardless of how active the funnel looks.
2. Decision Velocity: How long does it take your governance process to make a meaningful go/kill decision at each phase? Slow decisions are not careful decisions; they are expensive ones. Every week a viable project waits for a committee review is a week of competitive advantage lost. Every week, a failing project stays alive because no one has the mandate to kill it is a waste of compounding. Decision velocity, measured in days-to-decision per phase, is the leading indicator of governance health.
3. Time-to-Value (TTV): From the moment an idea is approved for development to the moment it generates its first measurable business outcome: revenue, cost reduction, customer acquisition, or otherwise. How many days elapse? TTV is the innovation equivalent of a sales cycle: the shorter and more predictable it becomes, the more confident you can be that the system is functioning. Benchmarking TTV against industry norms and your own historical performance turns it into a genuine strategic lever.
4. Strategic Alignment Score: What percentage of your active portfolio is directly tied to a stated strategic priority? This metric requires you to have stated strategic priorities, which is itself a forcing function. Organizations that track alignment score tend to be better at killing projects that are technically interesting but strategically irrelevant: the "cool science project" problem that silently consumes capacity in most innovation portfolios.
Running an Innovation Metrics Audit
If you’re not currently tracking the four metrics above, the fastest path forward is an honest audit of what you are tracking and why.
Start with a simple diagnostic: list every metric your innovation program reports on in a quarterly or annual review. Then classify each one as either an activity metric (counts something that happened) or an outcome metric (measures a result that matters to the business).
If more than half your list is activity metrics, you have a reporting architecture built for storytelling, not accountability.
The next step is not to immediately replace everything. It’s to add one outcome metric to your next leadership review. Portfolio yield rate is usually the easiest to calculate from data you already have and the most immediately clarifying. When leadership sees a yield rate for the first time, the conversation tends to shift quickly.
From there, building toward a full operating-discipline scorecard, one that tracks yield, velocity, time-to-value, and strategic alignment in a single view, becomes both urgent and achievable. This is exactly what a structured innovation management platform is designed to support: not just capturing ideas, but creating the feedback loops that tell you whether your process is actually producing results.
The Dashboard Your Innovation Function Deserves
The goal is not to make innovation feel more rigorous. The goal is to make it more rigorous: to build a system that surfaces the truth about what’s working, what isn’t, and where the real leverage is.
That requires a willingness to retire the metrics that make your program look busy in favor of the metrics that show whether it’s delivering. It requires governance structures capable of making real decisions, not just facilitating movement. And it requires leadership that treats a low yield rate as a problem to be solved, not a number to be hidden.
Innovation that operates as a discipline doesn’t just have a better process. It has a better mirror.
Build the mirror first. Everything else follows.
Innovation Cloud helps enterprises move from scattered innovation activity to structured, measurable impact. Schedule a demo to see how the platform supports portfolio governance, decision velocity, and outcome tracking.
